We don’t often celebrate a graph (in fact I can’t remember ever doing it before!) but this one is well worth shouting about.
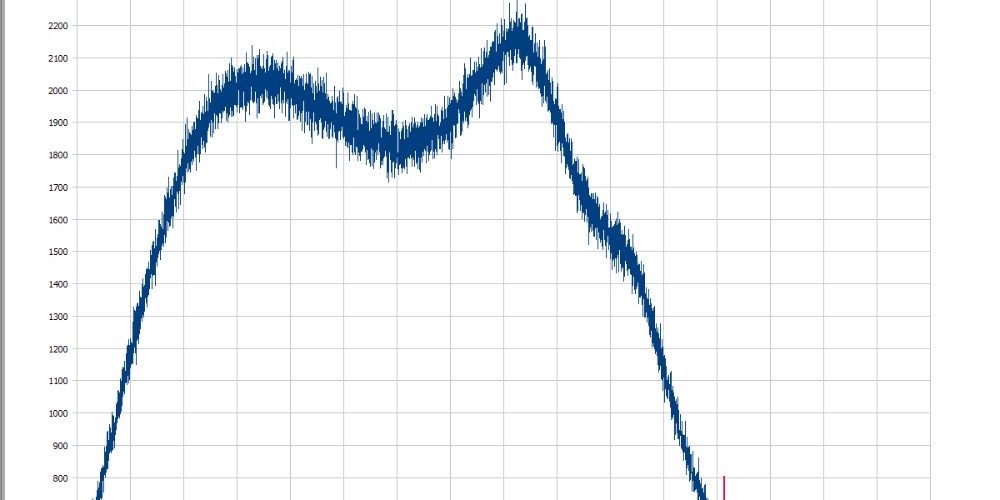
A couple of months back our prototype reader heated a DOSEmapper™ bead, counted the photons it emitted and plotted this “glow curve” graph. It is pretty much what everyone gets from a normal TLD (thermoluminescent dosimeter) reader so why the fuss? This one is from our utterly new design of reader which will read 100 micro silica DOSEmapper™ bead TLDs in about 15 minutes. Current TLD readers would take about 3 hours!
Our DOSEmapper™ technology and the reader will enable hospitals to quickly measure the actual dose of radiation received in-body at and around a patient’s tumour and compare it to the treatment plan. Clinicians can then correct any inaccuracies in the next session.
We have been supported for over a year by a great set of shareholders to develop this revolutionary new reader and, after the graph, it is now going into pre-production. That’s why a graph is well worth celebrating!

Leave A Comment
You must be logged in to post a comment.